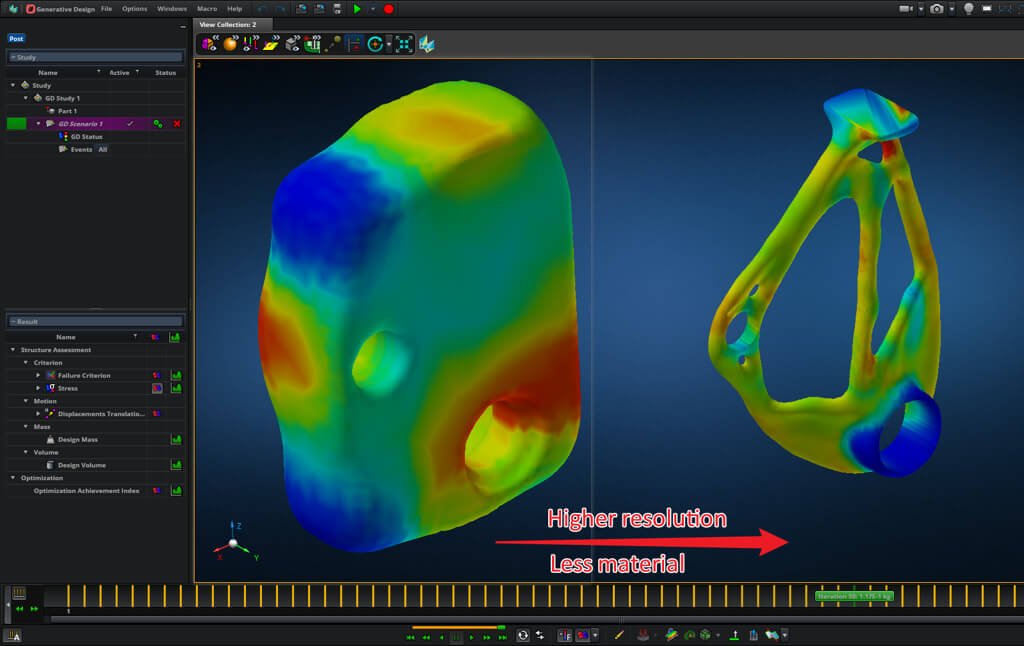
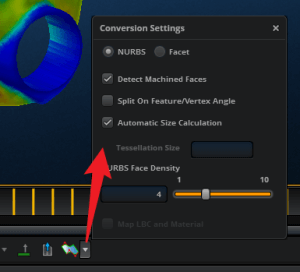
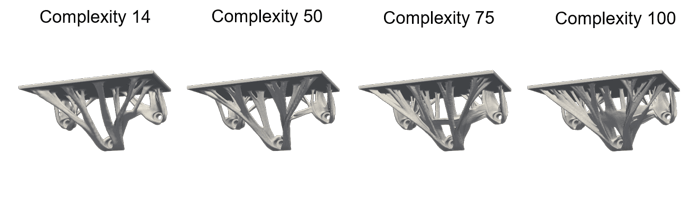
Apart from the density setting, the level of complexity (i.e. detail or resolution of features) can also be set using the complexity value.
The number provided here, has a unit of GB (of GPU or CPU memory) and relates to the amount of memory that the solver may use at the highest mesh resolution if no material was removed (at the last few highest resolution iterations).
Since material are always removed and seldom less than 50%, it's safe to set this value higher than the physical limitations of your hardware, but not too high.
To learn what that magic number is, you need to experiment a little since it will be different for every model and hardware setup.
The generally safe rule-of-thumb is to specify a number twice as high as what is physically available.
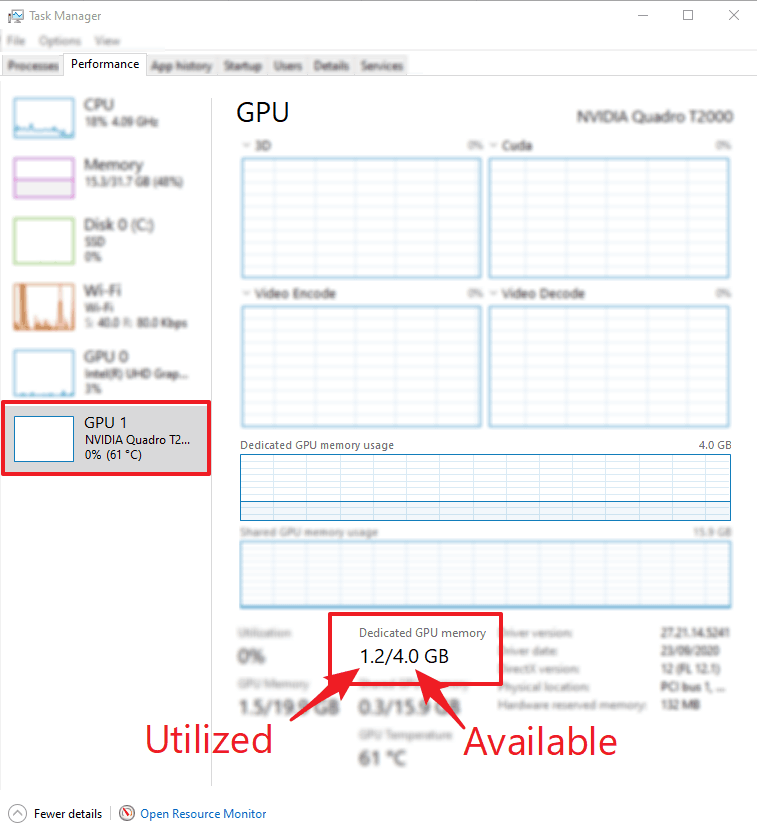
There are 2 ways to monitor how much GPU or CPU memory are actually being used during the simulation, but be aware that the initial iterations require the least amount of memory, while the last iterations generally requires the most.
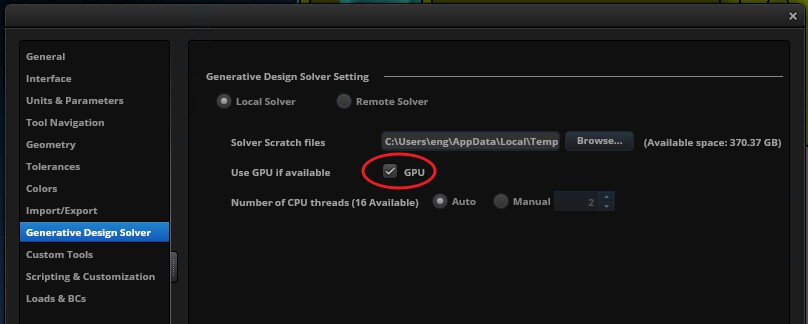
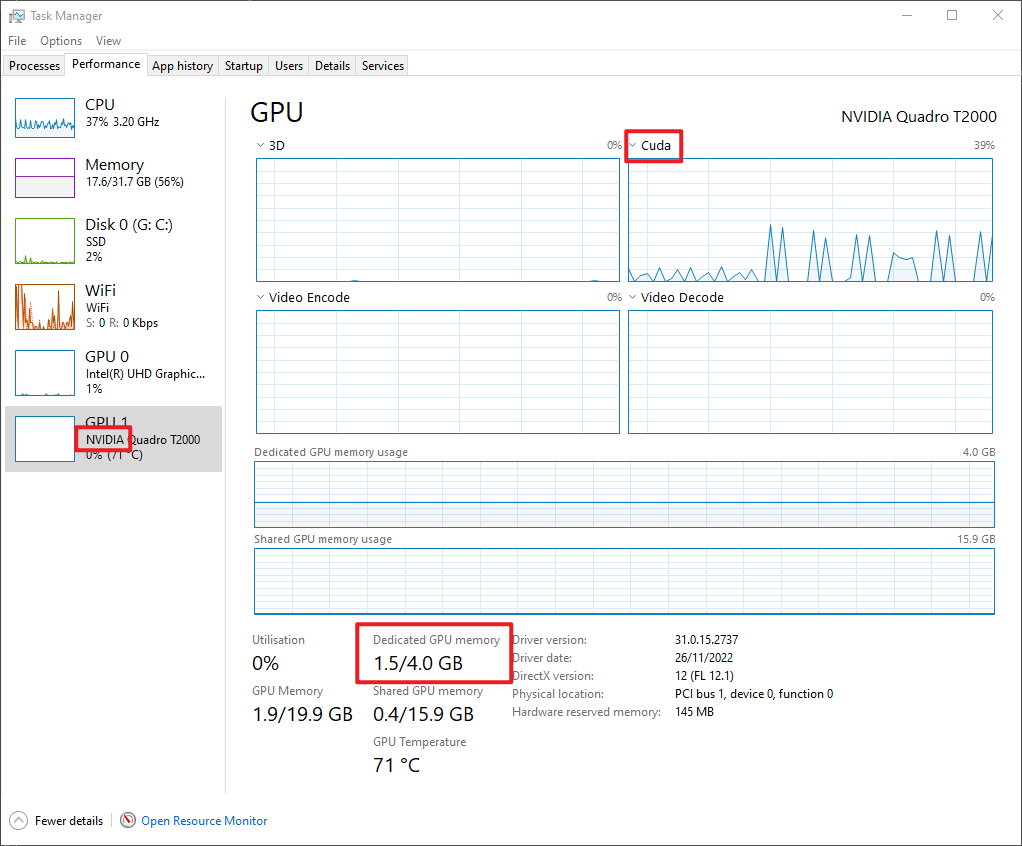
The first method is to simply monitor the resources in the Task Manager, but that will only show the current load on the system. When using the GPU, monitor its Dedicated Memory usage as shown below.
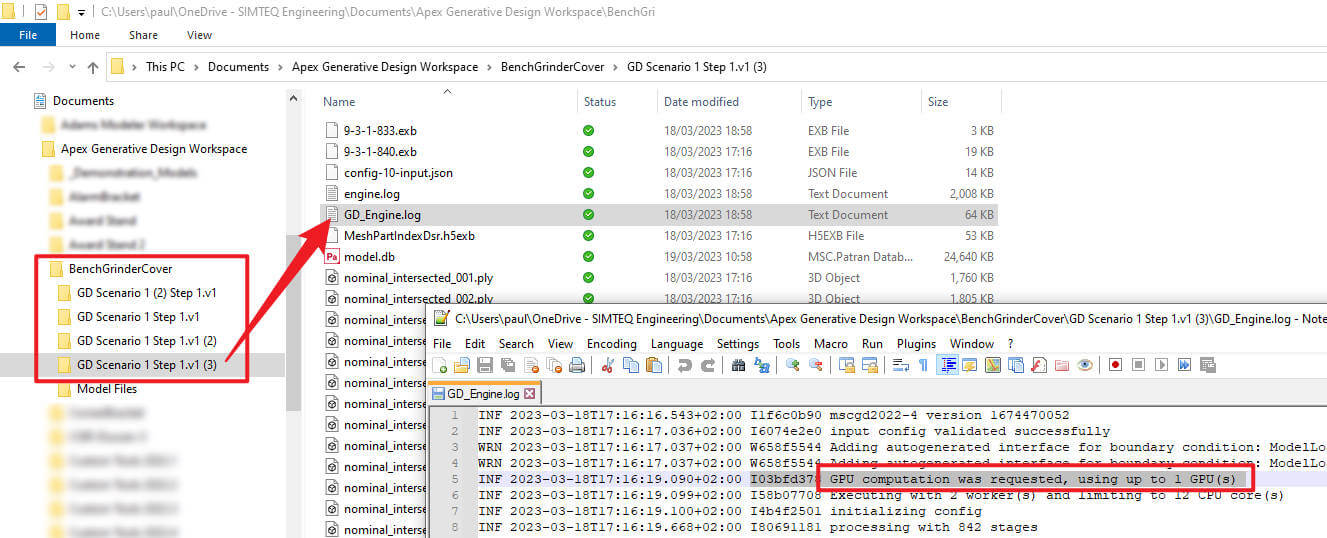
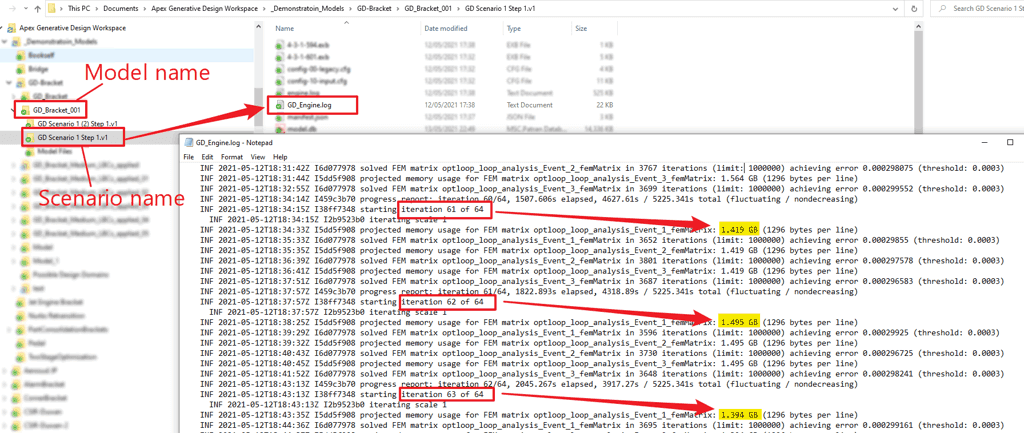
To see a history of memory usage per iteration, locate the folder where the results are being generated (under your project folder).
The GD_Engine.log file records the memory usage per iteration. The indicated memory recorded there (during the last few iterations when the highest resolution mesh is used), is the number that should not exceed the physically available dedicated memory.
If this value is still much lower than what is available, you may increase the Complexity value to obtain an even more detailed (higher resolution) result with your available hardware resources.